gnuplot1
以下のように >|tcsh| [bob-no-MacBook-Pro:Ruby/Excer/final] bob% cat route.res 0.548813503927325 0.715189366372419 0.423654799338905 0.645894113066656 0.77815675094985 0.870012148246819 0.978618342232764 0.799158564216724 0.963662760501029 0.383441518825778 0.791725038082665 0.528894919752904 ...
| < |
ファイルに保存しておいた街の位置情報をgnuplotを開いて, >|tcsh| [bob-no-MacBook-Pro:Ruby/Excer/final] bob% gnuplot
G N U P L O T
Version 4.4 patchlevel 0
last modified March 2010
System: Darwin 10.7.0
Copyright (C) 1986-1993, 1998, 2004, 2007-2010
Thomas Williams, Colin Kelley and many others
gnuplot home:     http://www.gnuplot.info
faq, bugs, etc:   type "help seeking-assistance"
immediate help:   type "help"
plot window:      hit 'h'
Terminal type set to 'aqua' gnuplot>
| < |
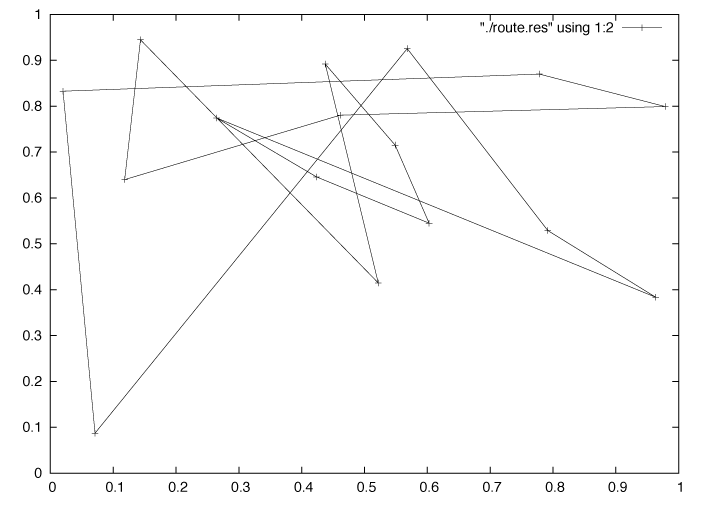
>|gnuplot| gnuplot> plot "./route.res" using 1:2 w lp
| < |
とすると次のように表示される.

シミュレーションにしたがってルートがほぐれていく様子を見るには,Gnuplot2を参照の事.
Keyword(s):
References:[FinalDayII]