muleなどで加工したデータをtest.datに入れる.terminalから
media> gnuplot
を起動. gnuplotのコマンドラインで
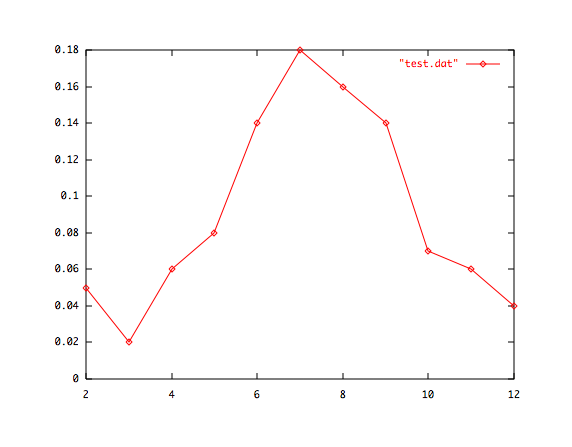
gnuplot> plot "test.dat" with linespoints
を入力すると下のような図が画面に現れます.

いったんpostscript形式でファイルに保存し,gvで表示させてプリンターから出力します.gnuplotのコマンドラインで
gnuplot> set term postscript
gnuplot> set output "test.ps"
gnuplot> replot
gnuplot> quit
termのシェルから
media> gv test.ps
とします.gvのメニューバーから印刷を選べばプリンターに出力されます.
二つのデータを表示する場合.
plot "test1.dat" w lp, "test2.dat" w lp
ここで'w lp'は'with linespoints'の略記法.